Implementation Description
| Version | Version Information | Date |
| Initial version | Ivan Popov, Vitaly Provodin, Nadya Morozova: document created. | Aug 10, 2006 |
Copyright 2005-2006 The Apache Software Foundation or its licensors,
as applicable.
Licensed under the Apache License, Version 2.0 (the "License"); you
may not use this file except in compliance with the License. You may
obtain a copy of the License at http://www.apache.org/licenses/LICENSE-2.0
Unless required by applicable law or agreed to in writing, software
distributed under the License is distributed on an "AS IS" BASIS,
WITHOUT WARRANTIES OR CONDITIONS OF ANY KIND, either express or
implied. See the License for the specific language governing
permissions and limitations under the License.
This document describes the architecture and design of the Java Debug Wire Protocol (JDWP) agent developed following JDWP specification [2] to support debugging Java* applications according to the Java* Platform Debug Architecture (JPDA) specifications [1]. This description covers the internal structure of the JDWP agent implementation and describes its key components. The document also gives instructions on extending the JDWP agent to enable more JDWP commands. It shows how the agent supports operation in a multi-threaded environment and logging for tracing agent execution.
Additionally, this document features a description of JDWP unit tests, their structure and design. The document describes the testing framework and explains how to use it to create new tests. It also provides useful information about running JDWP tests and using command-line options to control their execution.
The target audience for the document primarily includes those developers who wish to extend the JDWP agent with new features or to find and fix bugs in the agent implementation. This document can be also helpful for those who run JDWP tests against this JDWP agent or another JPDA implementation, or create new JDWP tests.
The JDWP agent description has the following major sections:
This document uses the unified conventions for the DRL documentation kit.
This part of the document includes the key terms and definitions related to the Java* Platform Debug Architecture and lists the key features of the current implementation.
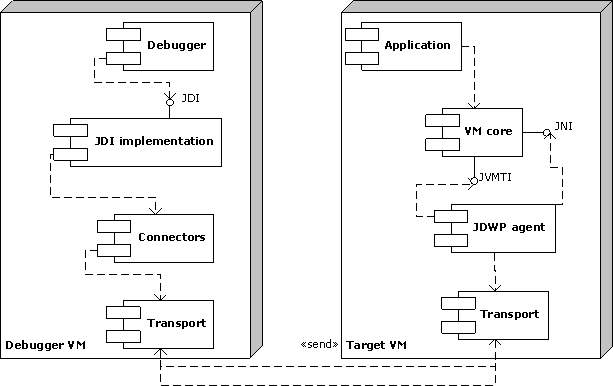
The Java* Platform Debug Architecture (JPDA) describes a set of API functions used for debugging Java* applications running in a Java* Virtual Machine (JVM). JPDA describes the following main APIs represented on different levels:
Figure 1 illustrates the JPDA structure.

Figure 1: JPDA Architecture
The JDWP agent is a JPDA component responsible for executing debugger commands sent to a target JVM. The debugger establishes a connection with the JDWP agent using any available transport and then interacts with the JDWP agent according to the JDWP specification [2]. This way, the debugger uses the connection to send commands and get replies with requested data and to set requests for specific events and receive asynchronous event packets with requested data when these events are triggered.
In the current implementation, the JDWP agent is a .dll
library loaded into the JVM process on JVM start according to
command-line options. The agent accesses JVM and application data via
the JVMTI and JNI interfaces exposed by JVM. The agent receives JDWP
commands from the debugger and triggers their execution using
corresponding calls to JVMTI and JNI functions. The JDWP agent works
as a usual JVMTI agent and follows the JVMTI specification [3].
For more information about JDWP agent and JDWP protocol, see [2].
The key features of this JDWP agent implementation are the following:
jdwpTransport API with the default TCP/IP socket transport
(dt_socket)
included This JDWP agent implementation is supplied with JDWP unit tests. The tests are based on the JDWP specification [2] and can be used for testing this agent or any other JDWP implementation.
JDWP tests are written in pure Java* and are based on the JUnit framework [6], so they can be executed in any environment that supports the JUnit format.
Note
These tests require two instances of JVM: debugger and debuggee. For that, the JUnit framework has been extended with JPDA testing framework to provide launching, connecting, and synchronization of two JVM instances in each test.
The JPDA testing framework encapsulates all efforts required to launch
a target JVM, establish a JDWP connection, and synchronize execution
of a debugged application, so that individual tests are relatively
simple.
Additionally, the framework can be configured to run tests in
different modes and configurations by specific properties.
JDWP tests provided with the JDWP agent have the following key features:
This part of the document is devoted to the internal structure of this implementation of the JDWP agent and the tests supplied with it.
This section describes the basic architecture of the JDWP agent. For a detailed description of data flows in the agent, see section 4. Usage Scenarios.
To serve as a bridge between the debugger and the target JVM, the JDWP agent implements the command execution flow. In this flow, the transport manager acts as a gateway for all incoming and outgoing packets, the packet dispatcher reads incoming commands, wraps them and transfers to the command dispatcher to find the appropriate command handler. These handlers actually execute commands and then send reply packets to the debugger via the transport manager.
Note
Command handlers normally return control after executing the command
with the exception of asynchronous handlers. The latter start
a separate thread to execute a command and return control immediately.
Asynchronous handlers are used for JDWP commands that may last long
and can be interrupted, for example, InvokeMethod.
Asynchronous handlers send reply packets to the debugger via the
transport manager after completing the command. If an error occurs during
command handling, the corresponding module forms an error reply packet
and sends it to the debugger.
Figure 2 shows dependencies between major JDWP agent components.
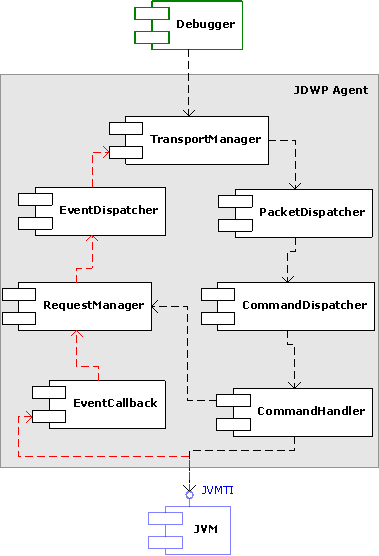
Figure 2: Structure of the JDWP Agent
Lines show dependencies between the components of the agent: Red lines are for generating events, and black lines – for command execution.
The other flow inside the JDWP agent is formed by events. In this flow, the request manager stores all event requests issued by the debugger and enables and disables triggering of JVMTI events by calling the event callbacks component. An event callback composes event packets of a specific type according to the stored event requests and passes them to the event dispatcher, which transfers the packets to the debugger via the transport manager.
The JDWP agent runs internal threads for its operation and can also access JVM threads. Basically, the agent has two internal threads that support the command and event flows plus temporary threads that asynchronous command handlers start for executing their commands. Event callbacks are invoked in the context of JVM threads. All other modules share their data between threads and ensure their thread-safe management.
All threads accessible for the JDWP agent are registered in its thread manager. This component suspends and resumes threads based on suspend counters, and hides specific internal threads from the debugger.
For details on how threads are synchronized in the agent, see Thread Synchronization.
To enable appropriate operation of the JDWP agent, the following core modules are used:
AgentAutoFree and
JvmtiAutoFree classes to automatically free memory
allocated in the memory manager or returned by JVMTI functions, for example:
{
    // does operation 1
    char* buf = GetMemoryManager().Allocate(size);
    AgentAutoFree af(buf);
    // does operation 2
}
AgentAutoLock wrappers around
AgentMonitor elements in a local block to specify
synchronized code blocks.
This approach to using thread monitors simplifies thread synchronization and ensures its safety,
for example:
AgentMonitor* monitor = new AgentMonitor("some_monitor_name");
{
    MonitorAutoLock lock(monitor);
    // does operation 1
    monitor->wait();
    // does operation 2
}
For an illustration of how all these components operate inside the agent, see the Usage Scenarios section.
The agent additionally features the following components:
MonitorAutoLock, AgentAutoFree,
JvmtiAutoFree ensure correct thread synchronization
and memory de-allocation.
AgentException class defines a tree of possible
error exceptions, which allow transferring information about
particular error between modules.
Each command in JDWP agent is handled by a corresponding class
SyncCommandHandler or AsyncCommandHandler,
which implements method execute(). This method reads data
from the command wrapper, performs required operations, and stores the
result data in the reply wrapper or, in case of error, throws the
appropriate exception. All command handlers are grouped according to
the JDWP command sets and placed to the commands/
directory.
To add a new JDWP command, define a new class based on
SyncCommandHandler or AsyncCommandHandler
and implement method execute(). Put this class to the
corresponding file according to the command set name in the
commands/ directory and edit
CommandDispatcher to use this class for handling new
commands.
Figure 3 shows the structure of a JDWP test.
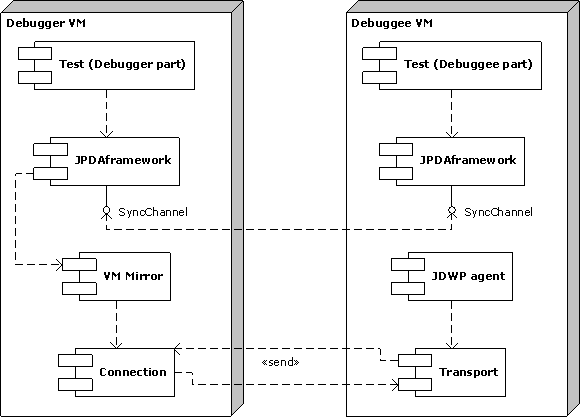
Figure 3: Testing Framework
As shown in the figure, the supplied JDWP tests go through the following life cycle:
JUnit tests must follow the naming policy closely linked with the name and structure of the class being tested. JDWP tests have no Java* classes to be tested. Instead, JDWP tests operate with JDWP commands and events, so it makes sense to name them according to JDWP command names and group them according to JDWP command sets. The following scheme is used for naming JDWP tests:
org.apache.harmony.jpda.tests.jdwp.<CommandSet>.<Command>Test
org.apache.harmony.jpda.tests.jdwp.Events.<Event>Test
If several tests are used for one command that require different debuggee applications, the tests are implemented in separate classes and the numerical suffix is added to the class name. For example:
org.apache.harmony.jpda.tests.jdwp.ObjectReference.GetValues001Test.java
org.apache.harmony.jpda.tests.jdwp.ObjectReference.GetValues002Test.java
Each JDWP test specifies the debuggee class to be run in the target JVM. Depending on the particular test case, tests can share the debuggee class or require individual debuggee classes.
The main part of the JPDA testing framework is implemented in the following packages:
org.apache.harmony.jpda.tests.framework
defines the means for debugger and debuggee classes, the
communication and synchronization channels, and so on. These can be
used for JDWP tests or any other JPDA tests, for example, JDI
tests.
org.apache.harmony.jpda.tests.framework.jdwp provides
support for JDWP connections, parsing and composing JDWP packets,
handling JDWP events, using specific JDWP data types, and so on. The package also provides VmMirror wrapper class for
JDWP connections that simplifies many operations to bring debuggee
JVM to a required state and obtain required data.
The JPDA testing framework does not use the JUnit framework directly
and can be used in any other testing environment. However, because
these tests are based on the JUint framework, the current
implementation features a thin layer between JPDA testing framework
and JUnit framework implemented in the
org.apache.harmony.jpda.tests.share package. This package
provides base classes for all JDWP tests. The JUnit framework launches
the classes and passes control to the JPDA testing framework that
provides the infrastructure for running JDWP tests.
For more detailed information, generate documentation from JDWP tests and the framework classes using a parser, such as Javadoc or Doxygen.
This part of the document describes the processes going on inside the JDWP agent during its operation and gives tips on using the agent and the tests supplied.
This section describes a typical data flow in the JDWP agent when handling commands received from the debugger.
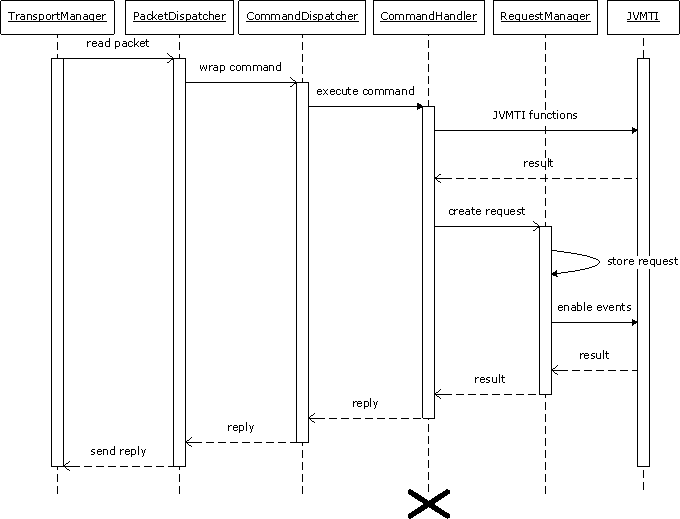
Figure 4: JDWP Agent Command Flow
As shown in the figure, a command packet passes the following stages:
If an error occurs, the corresponding exception is thrown on any phase and the calling module stores error info in the reply packet and sends it to debugger via transport manager (this is not shown on the picture in order to simplify the overall scheme).
Note
Figure 4 is simplified not to show that the request manager and the command handler call into the object manager and the thread manager to get the object IDs and the thread info. These calls into the thread and object managers are equally relevant for the command and event packet flows in the JDWP agent. See section 4.1.2 Event Flow below for a description of these steps.
This section describes a typical sequence that an event passes inside the JDWP agent.
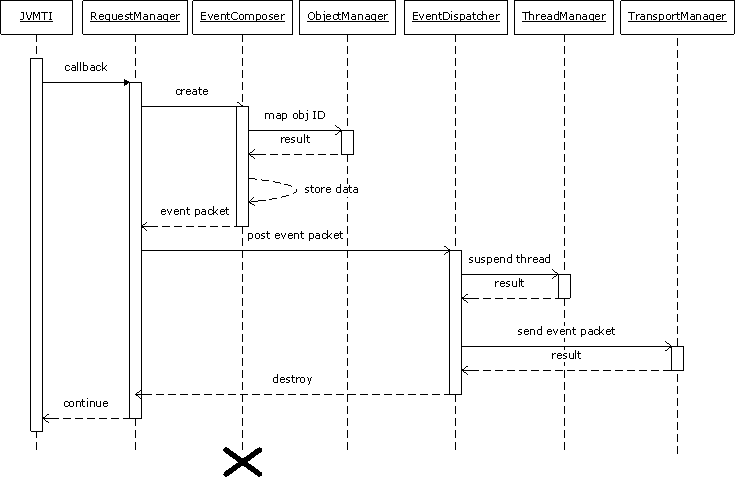
Figure 5: Event Flow in JDWP Agent
As shown in the figure, an event passes the following stages:
This agent implementation provides sophisticated means for tracing its
execution flow based on the trace macros defined in file
Log.h. See comments in this file source for definitions
of specific macros. The current implementation uses the following
trace message types:
CMD - JDWP commands execution
PACK - JDWP packets read/write operations
DATA - JDWP packets parsing and composing
EVENT - JDWP events tracing
MEM - memory allocation and de-allocation
MAP - object and class ID mapping
THRD - thread operations
MON - thread synchronization and monitor operations
PROG - program flow tracing
FUNC- agent functions entry/exit
JVMTI - JVMTI calls tracing
UTIL - auxiliary utility messages
LOG - arbitrary log messages
INFO - information and warning messages
ERROR - error messages
When adding new functionality to the JDWP agent, use the appropriate tracing macros to enable filtering messages with agent command-line options.
The agent supports the following additional options used for filter trace messages:
trace=log_kinds - applies filtering to log message kind (default: none)
src=sources - applies filtering to __FILE__ (default: all)
log=filepath - redirects output to the specified file
Use these options when you need to find a particular problem in agent execution.
To run JDWP tests in a default configuration, add the path to the test and framework classes into the CLASSPATH variable value and run the test class on the command line or from a JUnit testing environment.
You can control execution of JDWP tests by specifying JVM properties when starting the tests, as follows:
For these purposes, you can use the following properties:
jpda.settings.verbose=true|false - switching on the
verbose output of the test execution
jpda.settings.debuggeeClassName=<name> - the full
name of the class to run the debuggee with
jpda.settings.debuggeeJavaHome=<path> - the path to
the Java* bundle to run the debuggee JVM on
jpda.settings.debuggeeJavaExec=<name> - the name of
the Java* executable to run the debuggee on
jpda.settings.debuggeeJavaPath=<path> - the full
path to the Java* executable to run the debuggee on
jpda.settings.debuggeeAgentName=<name> - the name
of agent native library
jpda.settings.debuggeeAgentExtraOptions=<string> -
extra options for the JDWP agent
jpda.settings.debuggeeVMExtraOptions=<string> -
extra JVM options to run the debuggee with
jpda.settings.debuggeeLaunchKind=auto|manual - enabling
manual launching of the debuggee JVM
jpda.settings.transportWrapperClass=<name> - the
class name of the transport wrapper implementation
jpda.settings.transportAddress=<string> - the
address for the JDWP connection
jpda.settings.syncPort=<number> - the port number
for the sync connection
jpda.settings.timeout=<number> - the timeout value
used in JPDA tests, in milliseconds
jpda.settings.waitingTime=<number> - the timeout
value for waiting events, in milliseconds
Note
To use another transport implementation different from the default
TCP/IP socket transport, you must implement the special
TransportWrapper class from the
org.apache.harmony.jpda.tests.framework.jdwp package.
This implementation must be able to pass JDWP packet bytes right to
the specific transport. Alternatively, the implementation can use the JDI pluggable transport API to plug
available transport service providers included in the particular JDK
bundle. See JDI specification [4] for
com.sun.jdi.spi package for more details.
This implementation of the testing framework provides an additional
capability of running tests in the manual mode. In this mode, you can
launch the debuggee JVM manually on the command line or use a native
debugger or profiler. This is often necessary for debugging the JDWP
agent or JVM. To turn on the manual mode, specify the property
jpda.settings.debuggeeLaunchKind=manual and follow
instruction printed by the test.
[1] JPDA documentation, http://java.sun.com/products/jpda/index.jsp
[2] JDWP specification, http://java.sun.com/j2se/1.5.0/docs/guide/jpda/jdwp-spec.html
[3] JVMTI specification, http://java.sun.com/j2se/1.5.0/docs/guide/jvmti/jvmti.html
[4] JDI specification, http://java.sun.com/j2se/1.5.0/docs/guide/jpda/jdi/index.html
[5] Connection and Invocation Details, http://java.sun.com/j2se/1.5.0/docs/guide/jpda/conninv.html
[6] JUnit framework, http://www.junit.org/
(C) Copyright 2006 Intel Corporation
* Other brands and names are the property of
their respective owners.